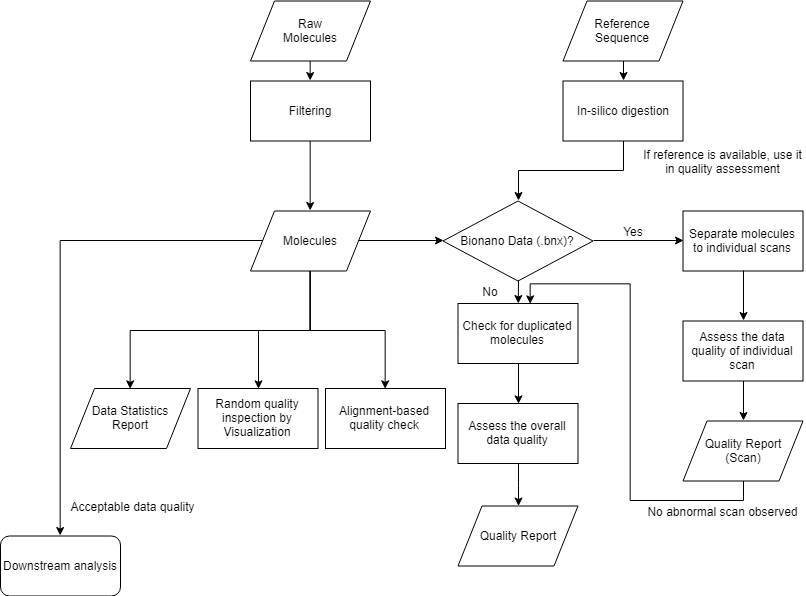
General information and Q&A
- Signal density
- Molecule length / Segment length / signal density distribution
- Data visualization
- Perform alignment (if reference is available)
Signal density
Theoretically, the detected signal density should be close to the expected signal density in the experimental design stage. If you see exceptionally low or high signal density, you are unlucky because there is a high chance that something in your data set goes wrong. In this case, you should proceed to check whether such abnormal signal density is attributed to all or small portion of optical maps. If it is the latter case, you may still have a chance to rescue your data set by filtering out the erroneous portion of optical maps, though this is not recommended if you have enough data coverage from other experimental runs on the same sample.
Abnormal molecule length / segment length / signal density distributions
The next step is to check for unpredicted systematic errors in your data set. Systematic errors can be detected partly by abnormal distribution of signal density, segment length and molecule length. However, sometimes you will only detect the systematic error by manually visualizing the optical maps.
Visualizations and abnormal patterns
Even statistics of your data set looks normal, you should also sample some molecules for visualization. Occasionally, there is a chance you can still observe molecules with strange behavior.
Duplicated molecules
Rarely, we detect duplicated molecules – the same set of DNA molecules that are processed twice. As a consequence, some DNA molecules will be represented by two nearly identical entries in the same data set. We could not identify the exact source of errors (For example, instrument imaging software bug, image processing bug, or even human error could all be the reason behind). Even they may not affect the outcomes significantly, it is always safe to take precaution of checking and removing any duplications.
Alignment
If you have a decent reference for your species, it is desirable to align the molecules onto the reference as a quality assessment measure. The mapping rate is one of the most useful indicators on data quality. Depending on the reference quality, alignment software and parameters, the expected mapping rate could range from 30% to 80%. A low expected mapping rate could be attributed to a wide range of factors, including a larger and more complex genome, low-quality genomes (short sequence scaffolds, scaffolds with many mis-assemblies), sub-optimal signal density.
Quick commands
Basic steps for quality assessment

Check if the data set has duplicated entries. Do the quality check by looking at the molecule length, segment length and signal density distribution. Finally generate the data coverage report.
java -jar OMTools.jar DuplicatedMoleculesDetection --optmapin Sample1.bnx --dupout sample1_duplicated.txt --thread 40
java -jar OMTools.jar DuplicatedMoleculesDetection --optmapin Sample2.bnx --dupout sample2_duplicated.txt --thread 40
java -jar OMTools.jar DuplicatedMoleculesDetection --optmapin Sample3.bnx --dupout sample3_duplicated.txt --thread 40
java -jar OMTools.jar DataQualityCheck --optmapin Sample1.bnx Sample2.bnx Sample3.bnx --prefix SampleQualityCheck_
java -jar OMTools.jar DataStatistics --optmapin Sample1.bnx Sample2.bnx Sample3.bnx --statout SampleStat.txt
Additional steps for quality assessment of BNX data
Separate the bnx data for data quality check per scan.
java -jar OMTools.jar SeparateBNXScan --optmapin Sample1.bnx --prefix Scan
java -jar OMTools.jar DataQualityCheck --optmapin Scan1.bnx Scan2.bnx Scan3.bnx Scan4.bnx --gradcolor true --prefix SampleScanQualityCheck_
Detailed commands
Duplicated molecules detection
java -jar OMTools.jar DuplicatedMoleculesDetection --optmapin Sample.bnx --dupout sample_duplicated.txt --thread 40
This command detects duplicated molecules from the sample. The file sample_duplicated.txt should contain none of the molecules. (Rarely you may have one to two molecules by random given you have very high data coverage)
Data quality check
Data quality check aims at checking for abnormal signal density, segment length, and molecule length. A filtered sample data file should be used.
java -jar OMTools.jar DataQualityCheck --optmapin Sample1.bnx Sample2.bnx Sample3.bnx --prefix SampleQualityCheck_
This command performs data quality check and outputs 3 graphs: SampleQualityCheck_LengthDistribution.png, SampleQualityCheck_SegmentLengthDistribution.png, and SampleQualityCheck_SignalDensityDistribution.png.E
java -jar OMTools.jar DataQualityCheck --optmapin Scan1.bnx Scan2.bnx Scan3.bnx --name Scan1 Scan2 Scan3 --gradcolor true --prefix SampleQualityCheck_
This command performs data quality check and rename the sample to “Scan1”, “Scan2” and “Scan3”. Gradient color is used in the output graph.